原文链接: https://www.ebayinc.com/stories/blogs/tech/sre-case-study-triage-a-non-heap-jvm-out-of-memory-issue/
Most Java virtual machine out of memory issues happen on the heap, but this time proved to be a little different.
A Java virtual machine (JVM) has an auto memory management feature, so Java developers don’t need to care about object reclaiming. But they should still be concerned about memory, as it isn’t unlimited, and we do see out of memory errors sometimes. For out of memory issues, there are generally two possible reasons: 1) the memory settings for the JVM are too small, and 2) applications have memory leaks. For the first type, it is easy to fix with more memory; just change some JVM memory setting parameters. For the second type, we need to figure out where the leak is and fix it in code. Today I am going to share a JVM memory leak case that is a little different.
Symptoms
At the beginning, we noticed garbage collection (GC) overhead exceeded and CPU usage alerts for some hosts. GC overhead was around 60%~70%, and the CPU was busy with GC. It appeared to be a memory issue.

gcoverhead2
Figure 1. GC overhead alert
Action
Not all the servers for that application had this issue, just some, which meant it could take time to fill up the memory, anywhere from 1 or 2 hours to a few days. In order to mitigate this issue on site, first we took a heap dump and then nuked them for temporary recovery.
Analysis
For GC overhead issues, we analyze the verbose GC log, analyze the heap dump, and analyze the source code.
- Analyze the verbose GC log

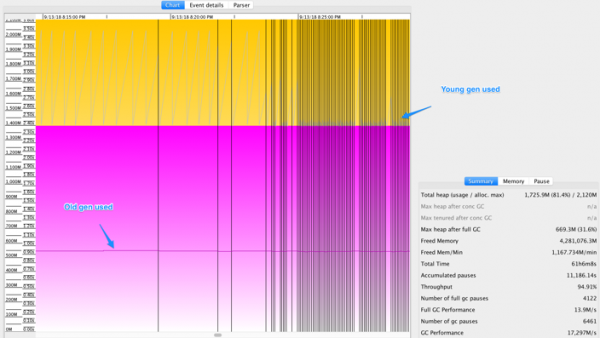
The app enables the verbose GC log, which is very useful to analyze memory issues. From the following screenshot, we can see there is a lot of free memory in both young and old generations, but GC is filling up more and more.
gcviewer
This is a little strange, as most of time, we see the both young and old generations are used up, and JVM doesn’t have enough heap to allocate a new object. This issue is not caused by less memory in the young/old generation, so where is the issue?
We all know that the JVM permanent generation full and explicit System.gc() call can also trigger a full GC. Next, we check these two possibilities:
- If the full GC is triggered by an explicit System.gc() call, we will see the “system” keyword in the GC log, but we don't see it this time.
- If it is triggered by permanent generation full, we can easily identify it in the GC raw log. From the following GC raw log, we can see that the permanent generation has enough free memory.
Verbose GC log snippet:
2018-09-13T20:23:29.058-0700: 2518960.051: [GC2018-09-13T20:23:29.059-0700: 2518960.051: [ParNew Desired survivor size 41943040 bytes, new threshold 6 (max 6) - age 1: 3787848 bytes, 3787848 total - age 2: 2359600 bytes,6147448 total : 662280K->7096K(737280K), 0.0319710 secs] 1224670K->569486K(2170880K), 0.0324480 secs] [Times: user=0.08 sys=0.00, real=0.03 secs]
2018-09-13T20:23:44.824-0700: 2518975.816: [Full GC2018-09-13T20:23:44.824-0700: 2518975.817: [CMS: 562390K->563346K(1433600K), 2.9864680 secs] 795326K->563346K(2170880K), [CMS Perm : 271273K->271054K(524288K)], 2.9869590 secs] [Times: user=2.97 sys=0.00, real=2.99 secs]
2018-09-13T20:23:58.130-0700: 2518989.123: [Full GC2018-09-13T20:23:58.131-0700: 2518989.123: [CMS: 563346K->561519K(1433600K), 2.8341560 secs] 867721K->561519K(2170880K), [CMS Perm : 271080K->271054K(524288K)], 2.8345980 secs] [Times: user=2.84 sys=0.00, real=2.83 secs]
2018-09-13T20:24:01.902-0700: 2518992.894: [Full GC2018-09-13T20:24:01.902-0700: 2518992.895: [CMS: 561519K->560375K(1433600K), 2.6886910 secs] 589208K->560375K(2170880K), [CMS Perm : 271055K->271055K(524288K)], 2.6891280 secs] [Times: user=2.69 sys=0.00, real=2.69 secs]
Therefore, these two possibilities have been ruled out.
In the past, we encountered a complicated case whose symptoms were similar: Both young generation and old generation had 700M free space separately after full GC, and no issue in permanent generation or explicit System.gc() call, but the JVM continued doing full GC. The cause was a java.util.Vector on heap that used about 400M memory, and it tried to extend its size. As the JDK code wrote, each time it extended, it doubled its size, so it needed an extra 800M memory to expand. The JVM couldn't find such a large free space, so it resorted to continuous full GC.
This time, we didn't see this kind of big collection instance.
- Check the application log, and find the issue
We started to analyze the heap dump, but in the meantime, in the application log, we see a very useful error message: java.lang.OutOfMemoryError: Direct buffer memory. This error points out where the issue is.
OOM error in the log:
INFO | jvm 1| 2018/09/15 03:43:13 | Caused by: java.lang.OutOfMemoryError: Direct buffer memory
INFO | jvm 1| 2018/09/15 03:43:13 | at java.nio.Bits.reserveMemory(Bits.java:658)
INFO | jvm 1| 2018/09/15 03:43:13 | at java.nio.DirectByteBuffer.(DirectByteBuffer.java:123)
INFO | jvm 1| 2018/09/15 03:43:13 | at java.nio.ByteBuffer.allocateDirect(ByteBuffer.java:306)
The direct buffer memory is the OS’ native memory, which is used by the JVM process, not in the JVM heap. It is used by Java NIO to quickly write data to network or disk; no need to copy between JVM heap and native memory. Java application can set the JVM parameter –XX:MaxDirectMemorySize to limit the direct buffer memory size. If no such parameter is set, the JVM can use all the available OS’ native memory. In our case, we checked the JVM’s parameter; it was set to -XX:MaxDirectMemorySize=1024M, which means this application set the Direct Buffer limit as 1G. Based on the above log, this 1G native memory was used up, and then threw the OOM error.
- Find the direct memory issue in the heap dump
Although the direct buffer memory is out of heap, the JVM still takes care of it. Each time the JVM requests a direct buffer memory, there will be a java.nio.DirectBuffer instance to represent it in the heap. This instance had the native memory address and the size of this memory block, etc. As the DirectBuffer instance’s life cycle was managed by the JVM, it could be collected by the GC thread when there was no reference to it. The associated native memory could also be released when the JVM GC thread collected the DirectBuffer instance.
Why does this app needs more than 1G direct buffer memory? Why it doesn’t it release the memory during the full GC? Now that we have the heap dump, can we find any clue from it? As we just mentioned, the DirectBuffer objects in the heap have some information about the direct buffer memory.
From the application error log, the JVM tries to create a new DirectByteBuffer instance. Let’s check the DirectByteBuffer first. With OQL, we see there are lots of DirectByteBuffer instances in the heap, and we don’t see other DirectBuffer instances, like DirectCharBuffers.
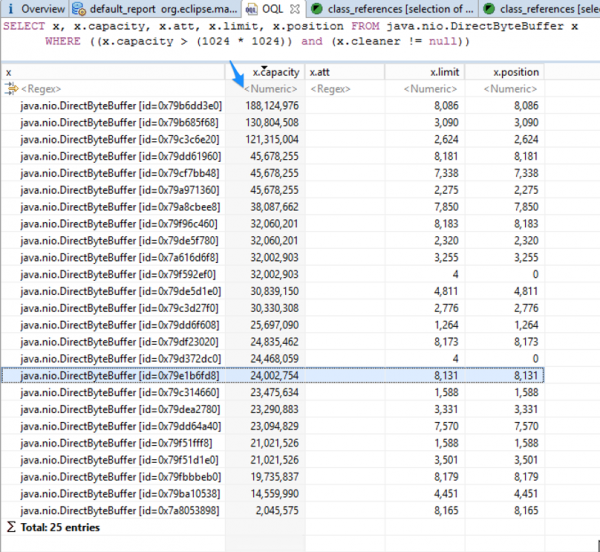
We can confirm how much native memory these DirectByteBuffers are using with this OQL query:
SELECT x, x.capacity FROM java.nio.DirectByteBuffer x WHERE ((x.capacity > 1024 * 1024) and (x.cleaner != null)) //here we only care objects whose capacity is bigger than 1M
The capacity field in DirectByteBuffer means how many memory are requested in the DirectByteBuffer instance. And here we filter the object instances with: x.cleaner != null, which means we skip the sliced DirectByteBuffer instances that are just a view of other DirectByteBuffer instances. In this dump, there are many DirectByteBuffer objects whose capacity is less than 1M; we just skip them. This is the result:

heapAnalysis
In this result, there are 25 instances that are holding more than 1M native memory. The biggest one is 179M (188124977/1024/1024), and second one is 124M (130804508/1024/1024). The summary of these top 25 instances is almost 1G. That’s why the total 1G direct buffer memory is used up.
- Why are these DirectByteBuffer not collected by GC?
If these DirectByteBuffer instances are collected by GC, then direct buffer native memory can also be released. Why can't these DirectByteBuffer instances be collected by the GC thread?
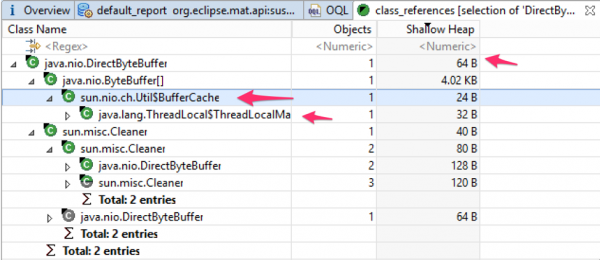
We further check the reference chain. From it, we can clearly see there are some thread local BufferCaches that are holding the references of DirectByteBuffer, and these thread local objects belong to some daemon threads, like the Tomcat daemon threads. That’s why they can’t be collected, as shown in the following reference chain screenshot:

Who put these DirectByteBuffers in these thread local BufferCaches? And why not remove them?
Following the reference chain, we looked into the source code of sun.nio.ch.Util.java class. In this class, you see the thread local BufferCache, and you see the method: getTemporaryDirectBuffer(int), which put the DirectByteBuffer objects in the BufferCache. This getTemporaryDirectBuffer is called by serval methods in JDK’s NIO classes. Also, the BufferCache reuses the DirectByteBuffer if the thread requests are not bigger direct buffer native memory. JDK NIO classes use these thread local DirectByteBuffer instances, but don’t release them if that thread is alive.
From above analysis, the issue is in the JDK’s code. This was identified as a JDK issue. In the JDK 8u102 Update Release Notes, a new system property, jdk.nio.maxCachedBufferSize, was added to fix this issue. But in this note, it also says, this parameter can only fix part of this issue and not all cases.
The fix
Most of the time, your application won’t have this issue because your threads are short-life threads, where BufferCache and DirectByteBuffer are collected by the GC thread, and the direct buffer native memory is released to the OS, or because where each time you just need very little direct buffer memory, and the JVM will reuse them. When the only multiple threads are long-life threads, and these threads request a more and more direct buffer memory until reach the max direct buffer limit or all the memory is used up, you will see this issue.
For our case, the app tries to allocate some direct buffer native memory for uploaded files, and Tomcat’s daemon threads handle these requests. There are some very big uploaded files, some more than 100M, and the app opens 40 daemon threads for Tomcat, then at last, it reaches the 1G direct buffer upper limit.
In order to fix it, the app should split bytes to small ones before they operate with NIO utilities. This can be changed in application logic.
Summary
Mostly we see out of memory issues on the heap, but it could happen on the direct buffer. When the direct buffer native memory is used up, even when it is not on the heap, we can still use a heap dump to help analyze the root cause.

